
It’s time to do it again, time to update one realtor’s perspective on the real estate and affordability trends on Whidbey Island. Some updates are repetitive, an exercise is keeping up to date even when nothing is happening. This is 2021; things are happening. Some things are happening in ways that are unexpected, to larger extents than usual, and may only be temporary or blips – or indications that a new normal is already being defined. This update will start with some of the same explanations as before, as a reminder of how I approach such things as well as an opportunity to thank those who help make it happen. You’re welcome to skip below if you already know how this goes.
From Whidbey Real Estate During Covid19 – April 4, 2021;
The real estate and affordability trends on Whidbey Island have been significant enough that I’ve been compiling data for a few years – and then Covid hit. Before the pandemic, updating the data every six months and presenting it at public events at the local libraries seemed about right. (Thanks, Sno-Isle Libraries for the inspiration and the opportunity.) Since the pandemic, things change every day, especially as vaccines race mutations. So, the frequency increased to every three months and the presentations are recorded online (working from home, of course.) These trends will continue to shift as ‘normal’ is being redefined, including those influences like schooling and working. Home is being redefined. The following will include three ways to explore the data and my insights. I am a broker with Dalton Realty, Inc. on Whidbey Island, but my perspective is just one of many. There are many brokers who can provide alternate opinions, as well as homeowners, contractors, financiers, and government employees who have other perspectives. Buying or selling houses isn’t trivial, so asking more than one person is prudent. And, of course, I’m available, too. And and of course of course, I look forward to when we can meet in person for presentations, and life in general.
Let’s start with the quick story, because for many people the issue comes down to house prices in their area. Prices are up. OK. Let’s add some detail to that. Here’s a synopsis for each of the three main areas on Whidbey Island. These are three of the slides from the full presentation which will be described in more detail later in this post. (Which has been having trouble uploading, pardon any glitches.) (Also, apologies for all of the white space, but I wanted to include these slides as presented.)


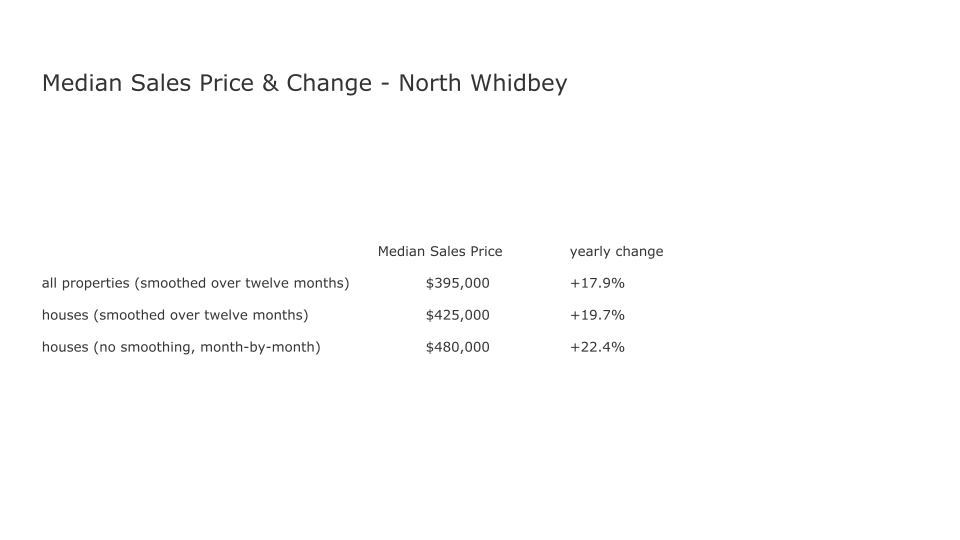
Depending on how the data are analyzed the detail about the trends can be vary, but every area is up by more than 15% within the recent twelve months. This continues the trend we’ve witnessed for years, even and especially, during the pandemic. The presentation goes into more detail, but in general, inventory (supply) remains historically low, demand remains high, and hence prices continue to increase, which also means affordability continues to be more difficult for many. Something else that hasn’t changed;
“People don’t want to sell until they can find something to buy,
but there’s little to buy because so few are willing to sell.”
Within that trend has been another that is more difficult to verify, yet significant enough to highlight. The notes on the data above are a clue. In this update the data were broken out into three levels of detail:
all properties (smoothed over twelve months)
houses (smoothed over twelve months)
houses (no smoothing, month-by-month)
Frequently, reports will state that the market is up or down. The market can mean many things. Here, the data are shown for ‘all properties’ which includes houses, land, condos, et al; and just houses. Houses are usually the largest and most expensive segment of the market. Houses are also the data most people are most interested in. Reporting on ‘all properties’ can under-report the more pertinent trend. The other distinction is ‘smoothed’ versus ‘no smoothing’. Real estate data, particularly in less-densely populated areas, can have more noise, be bouncier than places with more transactions happening more often. One way to quiet the noise is to average the data over a longer time, like twelve months. Besides, yearly comparisons make it easier to see changes in quieter times. Typically, I do not show the un-smoothed month-by-month data because any month can be an outlier, a time when by chance something swing the data temporarily. I hesitated to report on the month-to-month data for that reason, but the trend is so significant that I also felt odd about not reporting it. Here is the month-to-month data for houses in all three areas. You may see why I felt both ways about the situation.

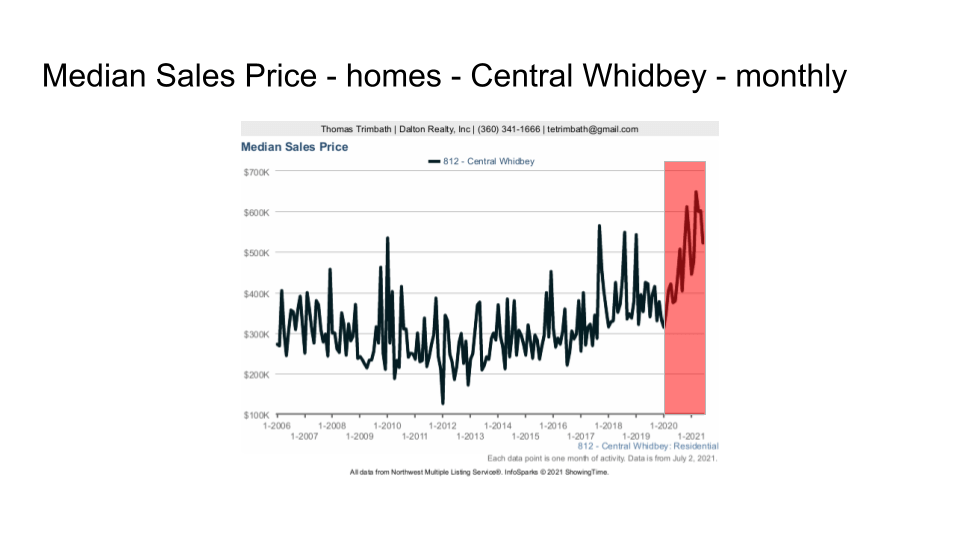
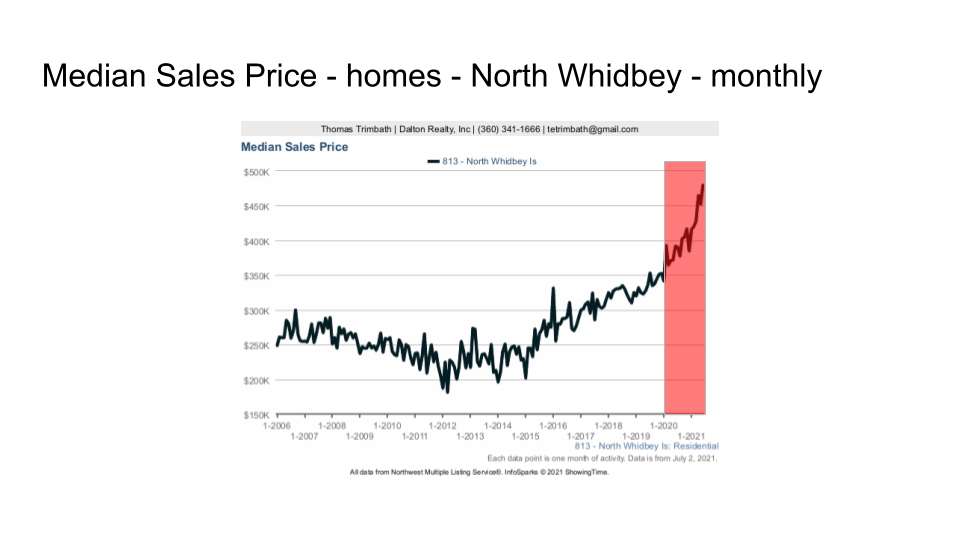
The areas in red highlight the time starting in 2020, basically the beginning of the pandemic response. Prices were accelerating then. At the start of 2021 there seemed to be a further acceleration, but there were so few data points that it was, and still can be, easy to dismiss any acceleration as a data artifact, or temporary. There is another interpretation that is worth noting, just in case. South Whidbey shows a dramatic rise.
houses (smoothed over twelve months) $594,500 +21.6%
houses (no smoothing, month-by-month) $825,000 +50.0%
A 50% jump in a year? That’s an impressive spike. Instead of a median sales price of ~$600K, it is over $800K, with much of that being within the most recent six months.
Or.
There’s that bumpy data for Central Whidbey. But then North Whidbey shows a rise, too, though one that is more moderate.
These are the kinds of changes that can redefine a market; in this case, South Whidbey more than the others; or South Whidbey may be leading the market. As the other major islands in the Puget Sound become even more unaffordable and have fewer houses to offer, Whidbey Island’s prices may, ‘may’, become more similar to those other islands and markets.
For more detail, I offer the presentation slides here (which makes it easier to squint at the data), as well as a video of the presentation (which includes my commentary – and the inevitable mis-spoken moment.)
Presentation (pptx – 50 slides, pdf available upon request) : Whidbey Island Real Estate Trends – July 2021

Video (YouTube – ~ one hour) : Whidbey Island Real Estate Trends – July 2021
Previous posts continue details on other topics. This one was long enough that I decided to only refer to those, rather than create an epic of repetition. (Previous posts about #RealEstate on #WhidbeyIsland.)
As always, your situation will differ because each house and each person is unique. You’re welcome to contact me if I can help. Also, as I say in the video, this is only one broker’s perspective. There are hundreds of brokers active on the island. Diversity and diversification have their advantages. Ask around. Talk to lenders and other locals for even more points of view. Real estate on an island is always interesting. It might get much more interesting, very soon.
