
The real estate and affordability trends on Whidbey Island have been significant enough that I’ve been compiling data for a few years – and then Covid hit. Before the pandemic, updating the data every six months and presenting it at public events at the local libraries seemed about right. (Thanks, Sno-Isle Libraries for the inspiration and the opportunity.) Since the pandemic, things change every day, especially as vaccines race mutations. So, the frequency increased to every three months and the presentations are recorded online (working from home, of course.) These trends will continue to shift as ‘normal’ is being redefined, including those influences like schooling and working. Home is being redefined. The following will include three ways to explore the data and my insights. I am a broker with Dalton Realty, Inc. on Whidbey Island, but my perspective is just one of many. There are many brokers who can provide alternate opinions, as well as homeowners, contractors, financiers, and government employees who have other perspectives. Buying or selling houses isn’t trivial, so asking more than one person is prudent. And, of course, I’m available, too. And and of course of course, I look forward to when we can meet in person for presentations, and life in general.
Synopsis
Median sales prices are up over 10%. The median time to sell a property has dropped from months several years ago, to days in some neighborhoods. Inventory continues to drop. According to the database, homes for sale had already dropped at least 40% in the decade prior to the pandemic; since then, even larger drops have happened – in only a few months. Globally, there are reports of small portions of city populations deciding to move to more rural areas, like Whidbey Island. But a small portion of a city can overwhelm the market in small towns and rural areas, particularly areas that have high-speed internet as Whidbey Island does. (High Speed Internet On A Slow Speed Island)
Whidbey Island is diverse enough in diverse ways that general trends can have isolated areas countering a trend, hence the usefulness of a deep-dive into data. You are encouraged to skip ahead to the parts that interest you. If you can’t find answers, as I said above you are encouraged to ask me and others.
Video Presentation (YouTube video ~ 1.5 hours): Whidbey Real Estate During the Pandemic – April 2021
Presentation Slides (pdf, 58 slides): Whidbey Real Estate During the Pandemic – April 2021
Narrative (notes that summarize my comments for most of the slides): See following
- Demand and supply were already dramatically affecting Whidbey Island’s real estate and affordability trends. The pandemic obviously had an effect, an effect that’s been happening for fifteen months, so far.
- Prices are up! That is no longer a surprise, but a year ago many were talking about a crash. Opinions went one way. The data went another way. Prices are up 12.7%.
- Prices are up, and have been; but the last fifteen months accelerated the trend.
- Price per square foot is up, too. The change has been higher, suggesting a change in house sizes, but not by much, 12.8%
- The market has also gotten busy. Instead of months, the median time on market is down to weeks, and sliding to down to days.
- Prices were up before the pandemic, partly because supply was down. During the pandemic, in the last twelve months the inventory has fallen another 55%. There’s a limit called zero. Something should happen between here and there, and it will probably happen soon.
- The two dominant types of real estate remain as houses and vacant land. Manufactured homes, condos, and farms are noticeable, but a smaller portion of the market (and more appropriate for private discussions about specific circumstances.)
- RESIDENTIAL HOUSES
- The house market that is the busiest is the range from $300K to $600K. The other ranges are busy, too; but the sweet spot for shoppers seems to be around a half a million dollars. Partly that’s because the price range is leaving fewer homes in the lower market. The high end market is naturally slower as the houses are more expensive, frequently more customized and complex, and have a smaller number of shoppers.
- House prices are up, particularly for the largest homes. Prices for more affordable houses are up over 13% to 19%, but the bigger houses are up over 34%. Home officing and schooling, perhaps?
- The most houses for sale, however, are in the 1,000 square foot to 2,000 square foot range. Very few houses under 1,000 square feet are for sale.
- The houses spending the least time on the market are those same 1,000 square feet to 2,000 square feet houses. Very large houses can still take months to sell, according to the median. Every group has sales happen much more quickly than that.
- VACANT LAND (note: the automated software incorrectly labels some land as ‘houses’ – hopefully that’s been accounted for in the data)
- The price ranges for land are arbitrarily different. The sub-$50K houses can include ‘recreational lots’, lots bought for the neighborhood’s amenities, not necessarily for building – though buildable lots can be found. The mid-range has the most, from $50K to $200K. All of the price ranges show lower inventory with a 66.7% drop for under $50K, a 49.3% drop for $50K to $200K, a 29.3% drop for $200K to $500K, and a 38.5% drop in inventory for $500K and above. These drops are only in the last twelve months, but the inventory has been dropping for years. Longer trends are affecting the market, including the fact that every year there are more houses there are necessarily fewer vacant lots.
- The data for how long land stays in the market is messy, but it shows it can still take months for lots to sell.
- It would seem logical that prices for land would follow the size of the lot, but the main discernible distinction is for lots under a half acre. None of the price trends for land are as clear as the ones for houses.
- Partly because of history, regulation, geography, and development, the largest and smallest lots remain the majority of the inventory.
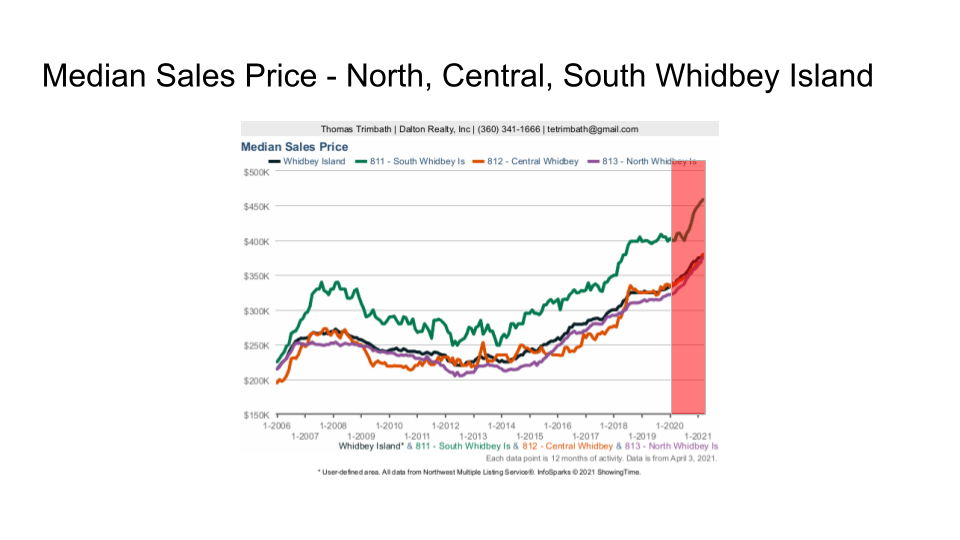
- ALL PROPERTIES – NORTH, CENTRAL, SOUTH (roughly Oak Harbor, Coupeville, Greenbank and south)
- The island is diverse but each area seems to have something that distinguishes, or makes it similar to another area. As for prices, north and central are similar, possible because of the population density, while the south end is stereotyped as retirees and commuters. The south end is significantly more expensive. All are rising close to the Island norms of 12.7%, and all are accelerating during the pandemic.
- The time on the market is least in the north, possibly because of the Navy activities and the younger demographics. All areas are showing shorter time on market, though the other areas are measured in a couple of weeks as compared to the north’s several days, or fewer.
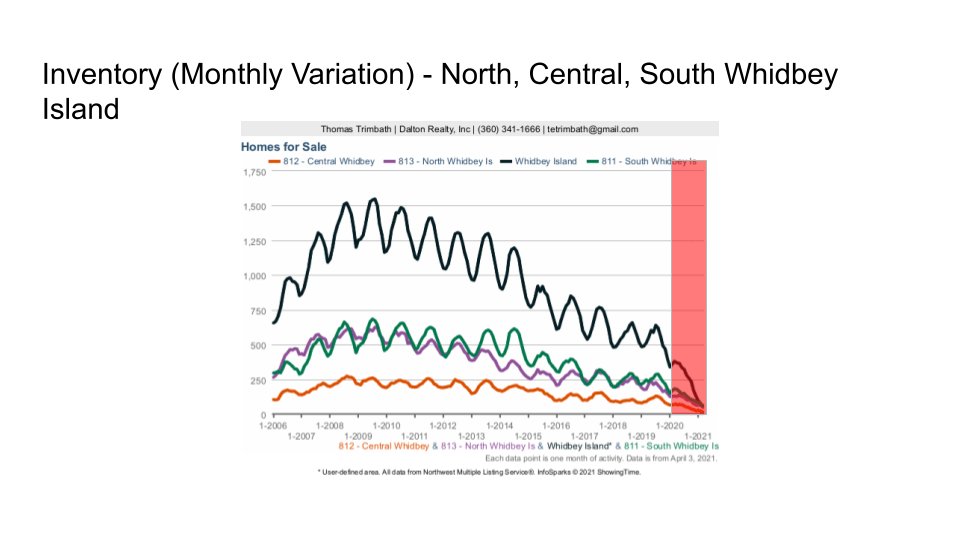
- The multi-year inventory declines accelerated through the island: north down 48%, central down 56.3%, south down 48.4%. None are at zero inventory, but the closest they’ve been in over a decade – when there were fewer people on the island.
- The previous slide was for data averaged over twelve months. Looked at month-by-month reveals even sharper declines: north down 62%, central down 81.9%, south down 67.4%. Monthly variations are expected, but the seasonal upswing that moderated the overall reduction didn’t happen in 2020, and hasn’t revealed itself on 2021. (A reason to stay tuned.)
- DEMOGRAPHICS AND AFFORDABILITY (this section is rarely updated as it requires updated governmental data – see previous presentations for more details)
- The island population continues to grow.
- Population projections are undoubtedly affected by a pandemic, but higher or lower is a guess.
- The north end of the island is roughly a generation younger than the rest of the island, which also suggests different spending, saving, and mobility rates. The gap is expanding.
- Measuring affordability by the median value of a house to the median income shows the ratio rising from 3.71 in 2000, to 4.95 in 2011-2015, with a peak unaffordability of almost 8.0 in Langley.
- Income numbers for reference. Note: Oak Harbor has the lowest.
- An estimate of the 2021 affordability measure shows the island becoming less affordable with the north at 6.86, central at 6.09, and the south at 7.2.
- Parts of Whidbey may be known as rich, but there’s poverty everywhere.
- Parts of Whidbey may be known as rich, but we have homeless people, too.
- Affordable housing also may recognize that in 2011-2015, as much as 27% of houses are considered vacant by the US Census Bureau (truly vacant, ghost homes, vacation homes, or secondary homes that could the third houses or fourth houses or…) The ascendance of vacation rentals, short term rentals, as well as the countering effect of weekenders turning a vacation property into a primary property should swing these percentages, though that may not stabilize for years as demographics and the economy shifts.
- REGIONAL AND BEYOND
- With a population of ~80,000, Whidbey Island is readily influenced by the more than 4,000,000 people on the mainland who may consider more remote housing options – and then there’s the rest of the world as de-urbanization develops and remote work grows.
- Of four of the major islands in the Puget Sound, Whidbey Island has the lowest median sales price.
- Comparing Whidbey Island to three cities on the mainland (Seattle, Bellingham, Everett), Whidbey Island maintains the lowest median sales price.
- Issues of supply and demand outside of Seattle are dwarfed by supply and demand changes in Seattle. For the larger picture, it is necessary to monitor Seattle.
- Relative to the rest of the Pacific Rim, Seattle is relative affordable, and of the islands, Whidbey is relatively affordable, which suggests Whidbey is not alone and the effects of supply and demand may be more noticeable elsewhere; but if you’re the one feeling the impact, the effect is significant enough.
- SCENARIOS (assumptions and stereotypes are happening in a changing world)
- Covid was surprise. Instead of shutting down Whidbey, Whidbey is now seen as an example of how responsible people can respond to a crisis, de-urbanization as people are drawn to Rural Distancing, and how remote working and learning can be made viable.
- The military’s influence is significant, but the military’s role, technology, and even budgets can shift. If the military was to change, there may yet be other uses for those properties.
- Tourism remains an identity for much of the island. The closing of borders shifted travel plans, but opened opportunities – for the businesses that could persist.
- The larger regional economy continues to shift because the region has some of the world’s most significant businesses. Will the area lose businesses (as Boeing and Amazon shift) or will the area attract businesses and workers who want a different environment culturally, naturally, …?
- Nature isn’t static. The area will continue to have earthquakes, tsunamis, landslide, storms, volcanoes, et al. A quake can change land levels in seconds, regardless of whether that makes a marina deeper or shallower, shifts water tables, or…?
- The Pacific Northwest is already accepting climate refugees as some to the island to move away from wildfires, floods, rising sea levels, hurricanes, tornadoes, and even politics.
- Technology continues to change, possibly making some lands more buildable, the island more sustainable, and individuals more independent.
- People don’t want to sell until they can find something to buy, but there’s little to buy because so few are willing to sell.
- How it changes is up to people, both current and future residents.
While I can enjoy data the way Star Trek’s Scotty could enjoy his technical journals, I understand that most folks won’t wade through all of this information. To those who enjoy that, nice to meet you. To everyone else, you’re welcome to ask questions – during business hours, of course. It’s spring on Whidbey; it’s time for me get out there and play – properly masked and distanced, naturally.
