
(Required Disclosure: Tom Trimbath is a real estate broker with Dalton Realty, Inc. on Whidbey Island. http://whidbeyrealtor.com/)
Another three months since my last analysis and presentation, and another variation on the story of real estate and affordability trends on Whidbey Island. When I started producing these about three years ago, there were two main concerns I heard about from clients and others in the industry: was the market about to correct because it had risen so much, or were we breaking free from history and rising into something new. A perceived slowdown inspired concern with some homeowners, and encouraged optimism from buyers waiting for something more affordable. Every six months I checked in while the climb continued. And then the pandemic hit. I couldn’t conduct the presentations in person, anymore, which was unfortunate because in-person presentations become more about what the audience is interested and has to say, than what I have to say. Well, for the last two years it’s been all about my side of the story. Also, for the last two years, the changes have been more dramatic, and happening in ways that were frequently unexpected. Unexpected trends continue. As usual, I’ll summarize (granted a looong summary, but part is cut & paste from before) a bit here, but primarily use this post as a repository of the links to the presentation slides, a video of my presentation of them, the narrative, and a synopsis of my commentary. Here we go – again.
The short version: Prices continue to rise, frequently by double digit percentages; possibly because interest and an ease in island living is up, while supply is down.

While that may be classic economics, there’s another consequence of the lower inventory which has been affecting the way the market is described.
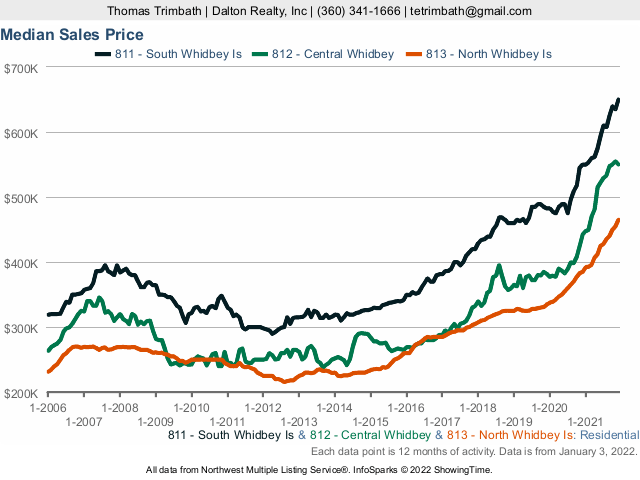
The data shown above is smoothed out over 12 months. It is tempting, and I am tempted to do so too, to look at one number as a way to typify the market. Unfortunately, the unsmoothed data, the data that only represents one month at a time, is more scattered. Scattered data is common when there’s less data. Take a look at the monthly data.

South Whidbey and Central Whidbey are smaller markets than North Whidbey. North Whidbey’s monthly numbers are better behaved, while the other two show variations of hundreds of thousands of dollars within a few months. That spike in South Whidbey that went to over $0.8M certainly got my attention, but it was followed by a drop to just over $0.6M. Those spikes can represent a new normal, but they can also mislead in either direction.
So, rather than look the at squiggly lines in the presentation, here are some numbers that might be useful. I didn’t include them in the presentation directly because graphs can be boring enough for some folks.
Median Sales Prices and Annual Percentage Changes – for any kind of non-commercial property
North Whidbey $438,500 | +21.8%
Central Whidbey $457,475 | +25.3%
South Whidbey $565,000 | +26.7%
Median Sales Prices and Annual Percentage Changes – for houses (not condos of manufactured houses)
South Whidbey $650,000 | +18.2%
Central Whidbey $550,000 | +24.3%
North Whidbey $465,000 | +20.8%
For some, that is sufficient. Instead of the conventional wisdom of housing rising a few percent, typically near inflation, usually with ups and downs, Whidbey has consistently had rising prices, and they’ve risen by double digit percentages, from 18.2% to 26.7%. Good news for some. Not-so-good news for others.
Guessing which way the prices will go has always been difficult, but in these dynamic times, I have little confidence in estimating, will guess when necessary, and am watching for a few specific scenarios – quietly.
Prices in almost anything are relative, so within the presentation are comparisons to other islands in Puget Sound, cities on the mainland, and cities around the Pacific Rim. There’s also data and discussion about shifting demographics and other influences on the island. If you are interested in those details, hopefully the information below will help.
As with all of this information, you are welcome to contact me if there’s any aspect of it you want to discuss.
The presentation slides (56 slides) – Whidbey Real Estate Update -January 2022
The presentation video, narrative, and commentary (~1 hour and 6 minutes) – Whidbey Real Estate Update – January 2022
The presentation narrative (italicized are copied from previous posts)-
- In general, prices rose at a similar pace
- When trying to understand any real estate data, check for specifics (any property or only houses, median or average, list price versus sold price, which area, which time frame, etc.)
- Even for one house (mine, so I don’t violate anyone else’s privacy) extensive algorithms don’t agree, except by chance.
- The rise is prices was accelerated during the pandemic.
- Monthly fluctuations can be misleading, or true, but that can only be verified in retrospect.
- Rural Distancing is like Social Distancing, but bigger and favors houses and rural areas.
- Whidbey’s market and population are small compared to the dense population areas from Vancouver to Olympia.
- All types of properties rose. The presentation will focus on the two biggest segments; houses and land.
- After a slight pause at the start of the pandemic, prices for houses rose dramatically.
- As inventory shrinks, the data becomes less clear.
- Regardless, inventories were dropping before the pandemic, and the trend accelerating. The market can’t go below zero, though, so the market may be close to a limit.
- Low supply and high enough demand is driving another metric, days on market towards but not through zero, too.
- Bidding wars, or at least offers for more than originally listed, aren’t as dramatic in terms of the median, but it is obvious that there was more negotiating room ten years ago.
- Looking at waterfront only, median prices are about twice non-waterfront prices.
- Regardless of being non-waterfront, prices remain higher.
- Land prices are less well-behaved, though that is probably because land has a wide range of challenges and opportunities. And yet, the general trend is up, though only now meeting the prices from 2008.
- Here, too, inventory was much lower before the pandemic, and the drop in supply quickened in the last two years.
- Days on market for land remains higher than for houses, but it is trending towards zero, too.
- While Whidbey may seem unaffordable, it remains attractive compared to other islands in Puget Sound.
- Whidbey’s market is small compared to the mainland but large compared to the other islands, and all have seen the same drop inventory.
- All islands are seeing similar days on market.
- Seattle continues to dominate the market. Whidbey remains more affordable than Everett and Bellingham, as well.
- Seattle continues to dominate the market in terms of supply as well. Small changes in Seattle’s market can overwhelm all of the surrounding markets.
- Every market is nearing minimums for how quickly houses stay listed.
- Bidding wars, or at least offers for more than list, are rising since about ten years ago, but Everett and Bellingham are rising fastest.
- (from before)
- Island Demographics and Economics – This was covered in previous presentations, so some of this is a copy and paste from those except for the last item.
- The island population continues to grow.
- Population projections are undoubtedly affected by a pandemic, but higher or lower is a guess.
- The north end of the island is roughly a generation younger than the rest of the island, which also suggests different spending, saving, and mobility rates. The gap is expanding.
- (see below)
- Parts of Whidbey may be known as rich, but there’s poverty everywhere.
- Parts of Whidbey may be known as rich, but we have homeless people, too.
- Affordable housing also may recognize that in 2011-2015, as much as 27% of houses are considered vacant by the US Census Bureau (truly vacant, ghost homes, vacation homes, or secondary homes that could the third houses or fourth houses or…) The ascendance of vacation rentals, short term rentals, as well as the countering effect of weekenders turning a vacation property into a primary property should swing these percentages, though that may not stabilize for years as demographics and the economy shifts.
- REGIONAL AND BEYOND
- With a population of ~80,000, Whidbey Island is readily influenced by the more than 4,000,000 people on the mainland who may consider more remote housing options – and then there’s the rest of the world as de-urbanization develops and remote work grows.
- Of four of the major islands in the Puget Sound, Whidbey Island has the lowest median sales price.
- Comparing Whidbey Island to three cities on the mainland (Seattle, Bellingham, Everett), Whidbey Island maintains the lowest median sales price.
- Issues of supply and demand outside of Seattle are dwarfed by supply and demand changes in Seattle. For the larger picture, it is necessary to monitor Seattle.
- Relative to the rest of the Pacific Rim, Seattle is relative affordable, and of the islands, Whidbey is relatively affordable, which suggests Whidbey is not alone and the effects of supply and demand may be more noticeable elsewhere; but if you’re the one feeling the impact, the effect is significant enough.
- SCENARIOS (assumptions and stereotypes are happening in a changing world)
- Covid was surprise. Instead of shutting down Whidbey, Whidbey is now seen as an example of how responsible people can respond to a crisis, de-urbanization as people are drawn to Rural Distancing, and how remote working and learning can be made viable.
- The military’s influence is significant, but the military’s role, technology, and even budgets can shift. If the military was to change, there may yet be other uses for those properties.
- Tourism remains an identity for much of the island. The closing of borders shifted travel plans, but opened opportunities – for the businesses that could persist.
- The larger regional economy continues to shift because the region has some of the world’s most significant businesses. Will the area lose businesses (as Boeing and Amazon shift) or will the area attract businesses and workers who want a different environment culturally, naturally, …?
- Nature isn’t static. The area will continue to have earthquakes, tsunamis, landslide, storms, volcanoes, et al. A quake can change land levels in seconds, regardless of whether that makes a marina deeper or shallower, shifts water tables, or…?
- The Pacific Northwest is already accepting climate refugees as some to the island to move away from wildfires, floods, rising sea levels, hurricanes, tornadoes, and even politics.
- Technology continues to change, possibly making some lands more buildable, the island more sustainable, and individuals more independent.
- People don’t want to sell until they can find something to buy, but there’s little to buy because so few are willing to sell.
- How it changes is up to people, both current and future residents.
- (from above)
- Measuring affordability by the median value of a house to the median income shows the ratio rising from 3.71 in 2000, to 4.95 in 2011-2015, with a peak unaffordability of almost 8.0 in Langley.
- Updated:

but more affordable than many places around the island.
Feeling overwhelmed? Imagine life as a broker. Fortunately for most people, it is good to know the general story, but only need to know about the property they have or the property they want. Hopefully this helps phrase questions, maybe even answers a few, and can lead to better conversations. I’m happy to help.
(Disclosure: I’m a real estate broker at Dalton Realty, Inc. http://whidbeyrealtor.com/).
