
(Required disclosure: I’m a broker at Dalton Realty, Inc. http://whidbeyrealtor.com/).
It was good to be back. My somewhat regular report about real estate and affordability trends on Whidbey Island was delivered to a live audience, again. For the last two years it has been online, which isn’t nearly as much fun. It also meant people were able to ask questions in real time. This post contains links to the video, the slides, the narrative, and some additional commentary. The title of the talk may be the simplest summary; “Weird Years For Whidbey Real Estate”. Here are some details behind that title.
For many the data summarizes the situation.
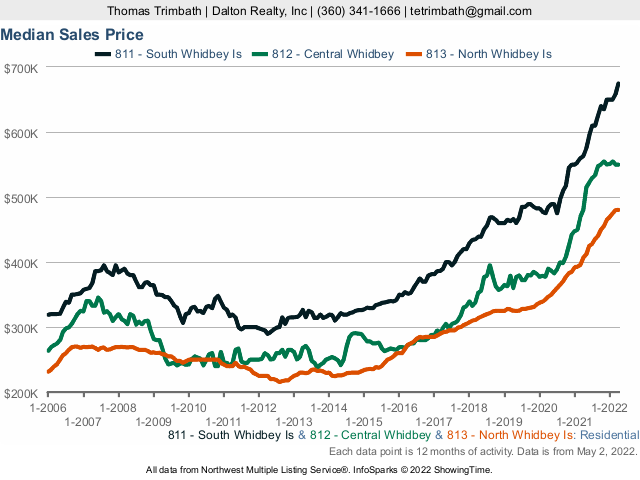
South $675,000 +19.8%
Central $550,000 +14.3%
North $480,250 +18.0%
Prices are up. That isn’t news. The story behind how, why, what, when, and where is why presentation took over an hour, and why this post took a day to produce.
We may be through the worst of the pandemic (stay tuned), so some are expecting a return to ‘normal’, but that normal has shifted.
Demand for Whidbey could increase. People are more likely to work from home, and that home can be more rural than before. People are appreciating the ability to grow some of their own food. The prospect of being restricted to a condo or apartment may inspire some to move to their own house and yard, even a small one.
Supply on Whidbey has diminished. Maybe it will recover and return, but many people on Whidbey who want to move find that they can’t because prices are so high elsewhere. Many people who would’ve moved have now decided that this is the place to be.
Many other factors influence supply and demand, but the general trend has been for more demand and less supply, which can explain higher prices. And, as prices rise faster than incomes, affordability suffers. It also can produce a favorable environment for sellers who are able to move. It also can also produce a favorable environment for investors, especially when Whidbey’s prices are relatively lower than other neighboring markets.
The various shifts in habits and lifestyles make it more likely that the old normal is gone. The trends are new enough, however, that the new normal hasn’t been defined – yet. That new normal is being defined by people, whether they realize it or not, and whether they are buyer or sellers or homeowners or renters or or or. This isn’t over. That’s is a good reason to stay tuned.
There’s some interest at one of the libraries for an update in a few months. If you want something sooner, contact me to work out the possibilities. The same is true if you want a similar presentation, possibly customized to specific situations.
In the meantime, here are some notes and the various links mentioned above. One suggestion, open the slides before starting the video. It is easier to see each slide better as a result.
The presentation narrative (Note: Italicized are copied from previous posts, which in a way is an indication that these same trends generate the same comments for months and years – so far.)
- When trying to understand any real estate data, check for specifics (any property or only houses, median or average, list price versus sold price, which area, which time frame, etc.)
- Even for one house (mine, so I don’t violate anyone else’s privacy) extensive algorithms don’t agree, except by chance. They do agree, however, on the general trend over years.
- The rise is prices was accelerated during the pandemic. The irony is that there was talk about a bubble in 2018 because the market leveled off for a while. Now, we’re talking about a bubble again.
- Monthly fluctuations can be misleading, or true, but that can only be verified in retrospect.
- Houses
- After a slight pause at the start of the pandemic, prices for houses rose dramatically.
- The similar rise in price per square foot suggests that house size was not a significant driver.
- Days On Market has shrunk to basically just under a week. It is hard for it to drop much further.
- Inventories were dropping before the pandemic, and the trend accelerating. The market can’t go below zero, though, so the market may be close to a limit.
- Historically, Monthly Supply (the amount of time it would take to sell all of the listings at the current rate) was considered a healthy balance when near six months. It is much less now.
- Bidding wars, or at least offers for more than originally listed, aren’t as dramatic in terms of the median, but it is obvious that there was more negotiating room ten years ago.
- South Whidbey
- The inventory for all houses is down, and that accelerated during the pandemic; but the most significant drop may be the apparent lack of houses for sale at or below $300,000.
- Looking at waterfront only, median prices are about twice non-waterfront prices.
- The rise in waterfront prices may be reflecting the fact that waterfront is always limited and in demand.
- Central Whidbey
- Similar to South Whidbey’s story, but with less certainty to the data because there are fewer listings in the area (roughly from Greenbank Farm to Penn Cove).
- North Whidbey
- Similar to the story behind the other two areas, but prices are generally lower which enables more affordable housing, and existing infrastructure limits the amount of waterfront available.
- Land
- Land prices are less well-behaved, though that is probably because land has a wide range of challenges and opportunities. And yet, the general trend is up, though only now meeting the prices from 2008.
- Here, too, inventory was much lower before the pandemic, and the drop in supply quickened in the last two years.
- Days on market for land remains higher than for houses, but it is trending towards zero, too.
- Island Affordability
- While Whidbey may seem unaffordable, it remains attractive compared to other islands in Puget Sound.
- Neighboring Cities
- Whidbey’s market is small compared to the mainland but large compared to the other islands, and all have seen the same drop inventory.
- Seattle continues to dominate the market. Whidbey remains more affordable than Everett and Bellingham, as well.
- Seattle continues to dominate the market in terms of supply as well. Small changes in Seattle’s market can overwhelm all of the surrounding markets.
- Pacific Rim
- Whidbey’s market and population are small compared to the dense population areas from Vancouver to Olympia.
- Rural Distancing is like Social Distancing, but bigger and favors houses and rural areas.
- Relative to the rest of the Pacific Rim, Seattle is relative affordable, and of the islands, Whidbey is relatively affordable, which suggests Whidbey is not alone and the effects of supply and demand may be more noticeable elsewhere; but if you’re the one feeling the impact, the effect is significant enough.
- With a population of ~80,000, Whidbey Island is readily influenced by the more than 4,000,000 people on the mainland who may consider more remote housing options – and then there’s the rest of the world as de-urbanization develops and remote work grows.
- Island Demographics And Economics
- Measuring affordability by the median value of a house to the median income shows the ratio rising from 3.71 in 2000, to 4.95 in 2011-2015, with a peak unaffordability of almost 8.0 in Langley. May 2022 ~ 10.6 (estimated)
- Affordable housing also may recognize that in 2011-2015, as much as 27% of houses are considered vacant by the US Census Bureau (truly vacant, ghost homes, vacation homes, or secondary homes that could the third houses or fourth houses or…) The ascendance of vacation rentals, short term rentals, as well as the countering effect of weekenders turning a vacation property into a primary property should swing these percentages, though that may not stabilize for years as demographics and the economy shifts.
- Parts of Whidbey may be known as rich, but there’s poverty everywhere.
- Parts of Whidbey may be known as rich, but we have homeless people, too.
- The island population continues to grow.
- The north end of the island is roughly a generation younger than the rest of the island, which also suggests different spending, saving, and mobility rates. The gap is expanding.
- The south end of the island may already be witnessing a generational shift as sole-proprietors retire.
- Scenarios (assumptions and stereotypes are happening in a changing world)
- Covid was surprise. Instead of shutting down Whidbey, Whidbey is now seen as an example of how responsible people can respond to a crisis, de-urbanization as people are drawn to Rural Distancing, and how remote working and learning can be made viable. Too few workers may also be a consequence.
- The military’s influence is significant, but the military’s role, technology, and even budgets can shift. If the military was to change, there may yet be other uses for those properties.
- Tourism remains an identity for much of the island. The closing of borders shifted travel plans, but opened opportunities – for the businesses that could persist.
- The larger regional economy continues to shift because the region has some of the world’s most significant businesses. Will the area lose businesses (as Boeing and Amazon shift) or will the area attract businesses and workers who want a different environment culturally, naturally, …?
- Nature isn’t static. The area will continue to have earthquakes, tsunamis, landslide, storms, volcanoes, et al. A quake can change land levels in seconds, regardless of whether that makes a marina deeper or shallower, shifts water tables, or…?
- The Pacific Northwest is already accepting climate refugees as some to the island to move away from wildfires, floods, rising sea levels, hurricanes, tornadoes, and even politics.
- Technology continues to change, possibly making some lands more buildable, the island more sustainable, and individuals more independent.
- People don’t want to sell until they can find something to buy, but there’s little to buy because so few are willing to sell.
- How it changes is up to people, both current and future residents.
The presentation slides (65 slides) – Weird Years For Whidbey Real Estate – May 2022
The presentation video, narrative, and commentary (~1 hour and 12 minutes) – Weird Years For Whidbey Real Estate – May 2022
Got questions? Contact me and I’ll see what I can do.

“weird years for whidbey” slide link in email send you to a one page advert, not the 65 pg slide deck presentation.
LikeLike
You were correct. My apologies. It should work now.
LikeLike